






















Dam Monitoring

Joint movement and wall geometry based on a single dataset

The 6D sensor measures displacement at expansion joints with a repeatability of ±50 µm and ±0.1°, while the GNSS system simultaneously monitors large-scale deformation of the wall.

These companies rely on our sensor technology

Logo: The Highway
DB
OeBB_INFRA logo
PORR Logo
STRABAG Logo
Asfinag_Logo
Intermetric Logo
Axpo logo
GalaxyCity Logo
BHOE Logo
Logo of the Diocese of St. Pölten
GEOSYS International Logo
City of Vienna logo
SalzburgAG logo
Logo-ZP
Logo-RETTER-and-Partners
Logo-Poettinger
Logo-NOE-Railways
Logo-NOE
Logo - HEIGL-BAU
Logo City Vienna
Pictures (10)
Pictures (9)

The wall shifts every day, but the inspection only looks at the reference date

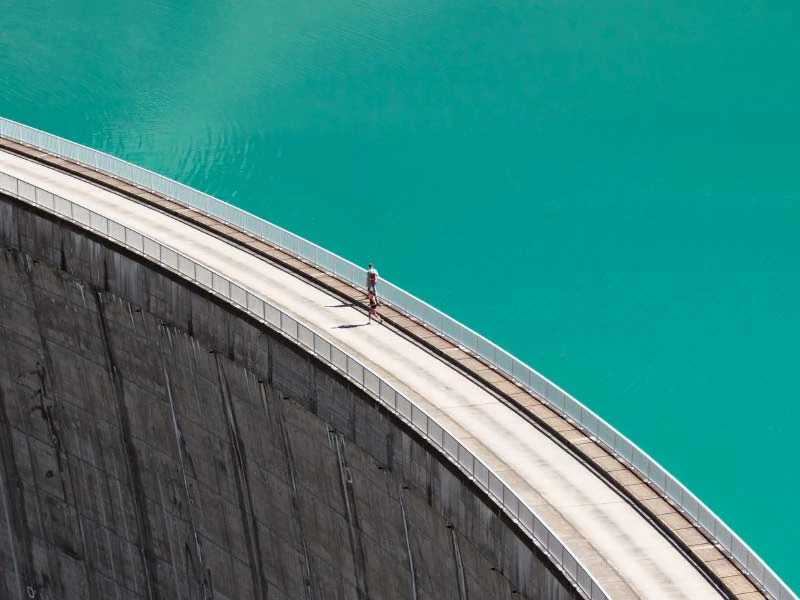
A dam wall deforms due to water pressure, temperature, and the changing seasons. The wall blocks push against each other at the expansion joints, the entire geometry of the wall shifts over the course of the year, and the surrounding slopes move. These movements are reversible as long as they remain within the expected range.
The routine dam inspection assesses the condition of the dam as of a specific date. Without continuous monitoring, it is impossible to detect changes that occur between inspections—such as a joint widening further than in the previous year or settlement exceeding seasonal variations. For a structure that could affect an entire valley in the event of damage, this gap poses a risk.
SuessCo Sensor

This is how our sensors continuously monitor your dam

1
6D Assembly Instructions

Install sensors on the expansion joint and the wall

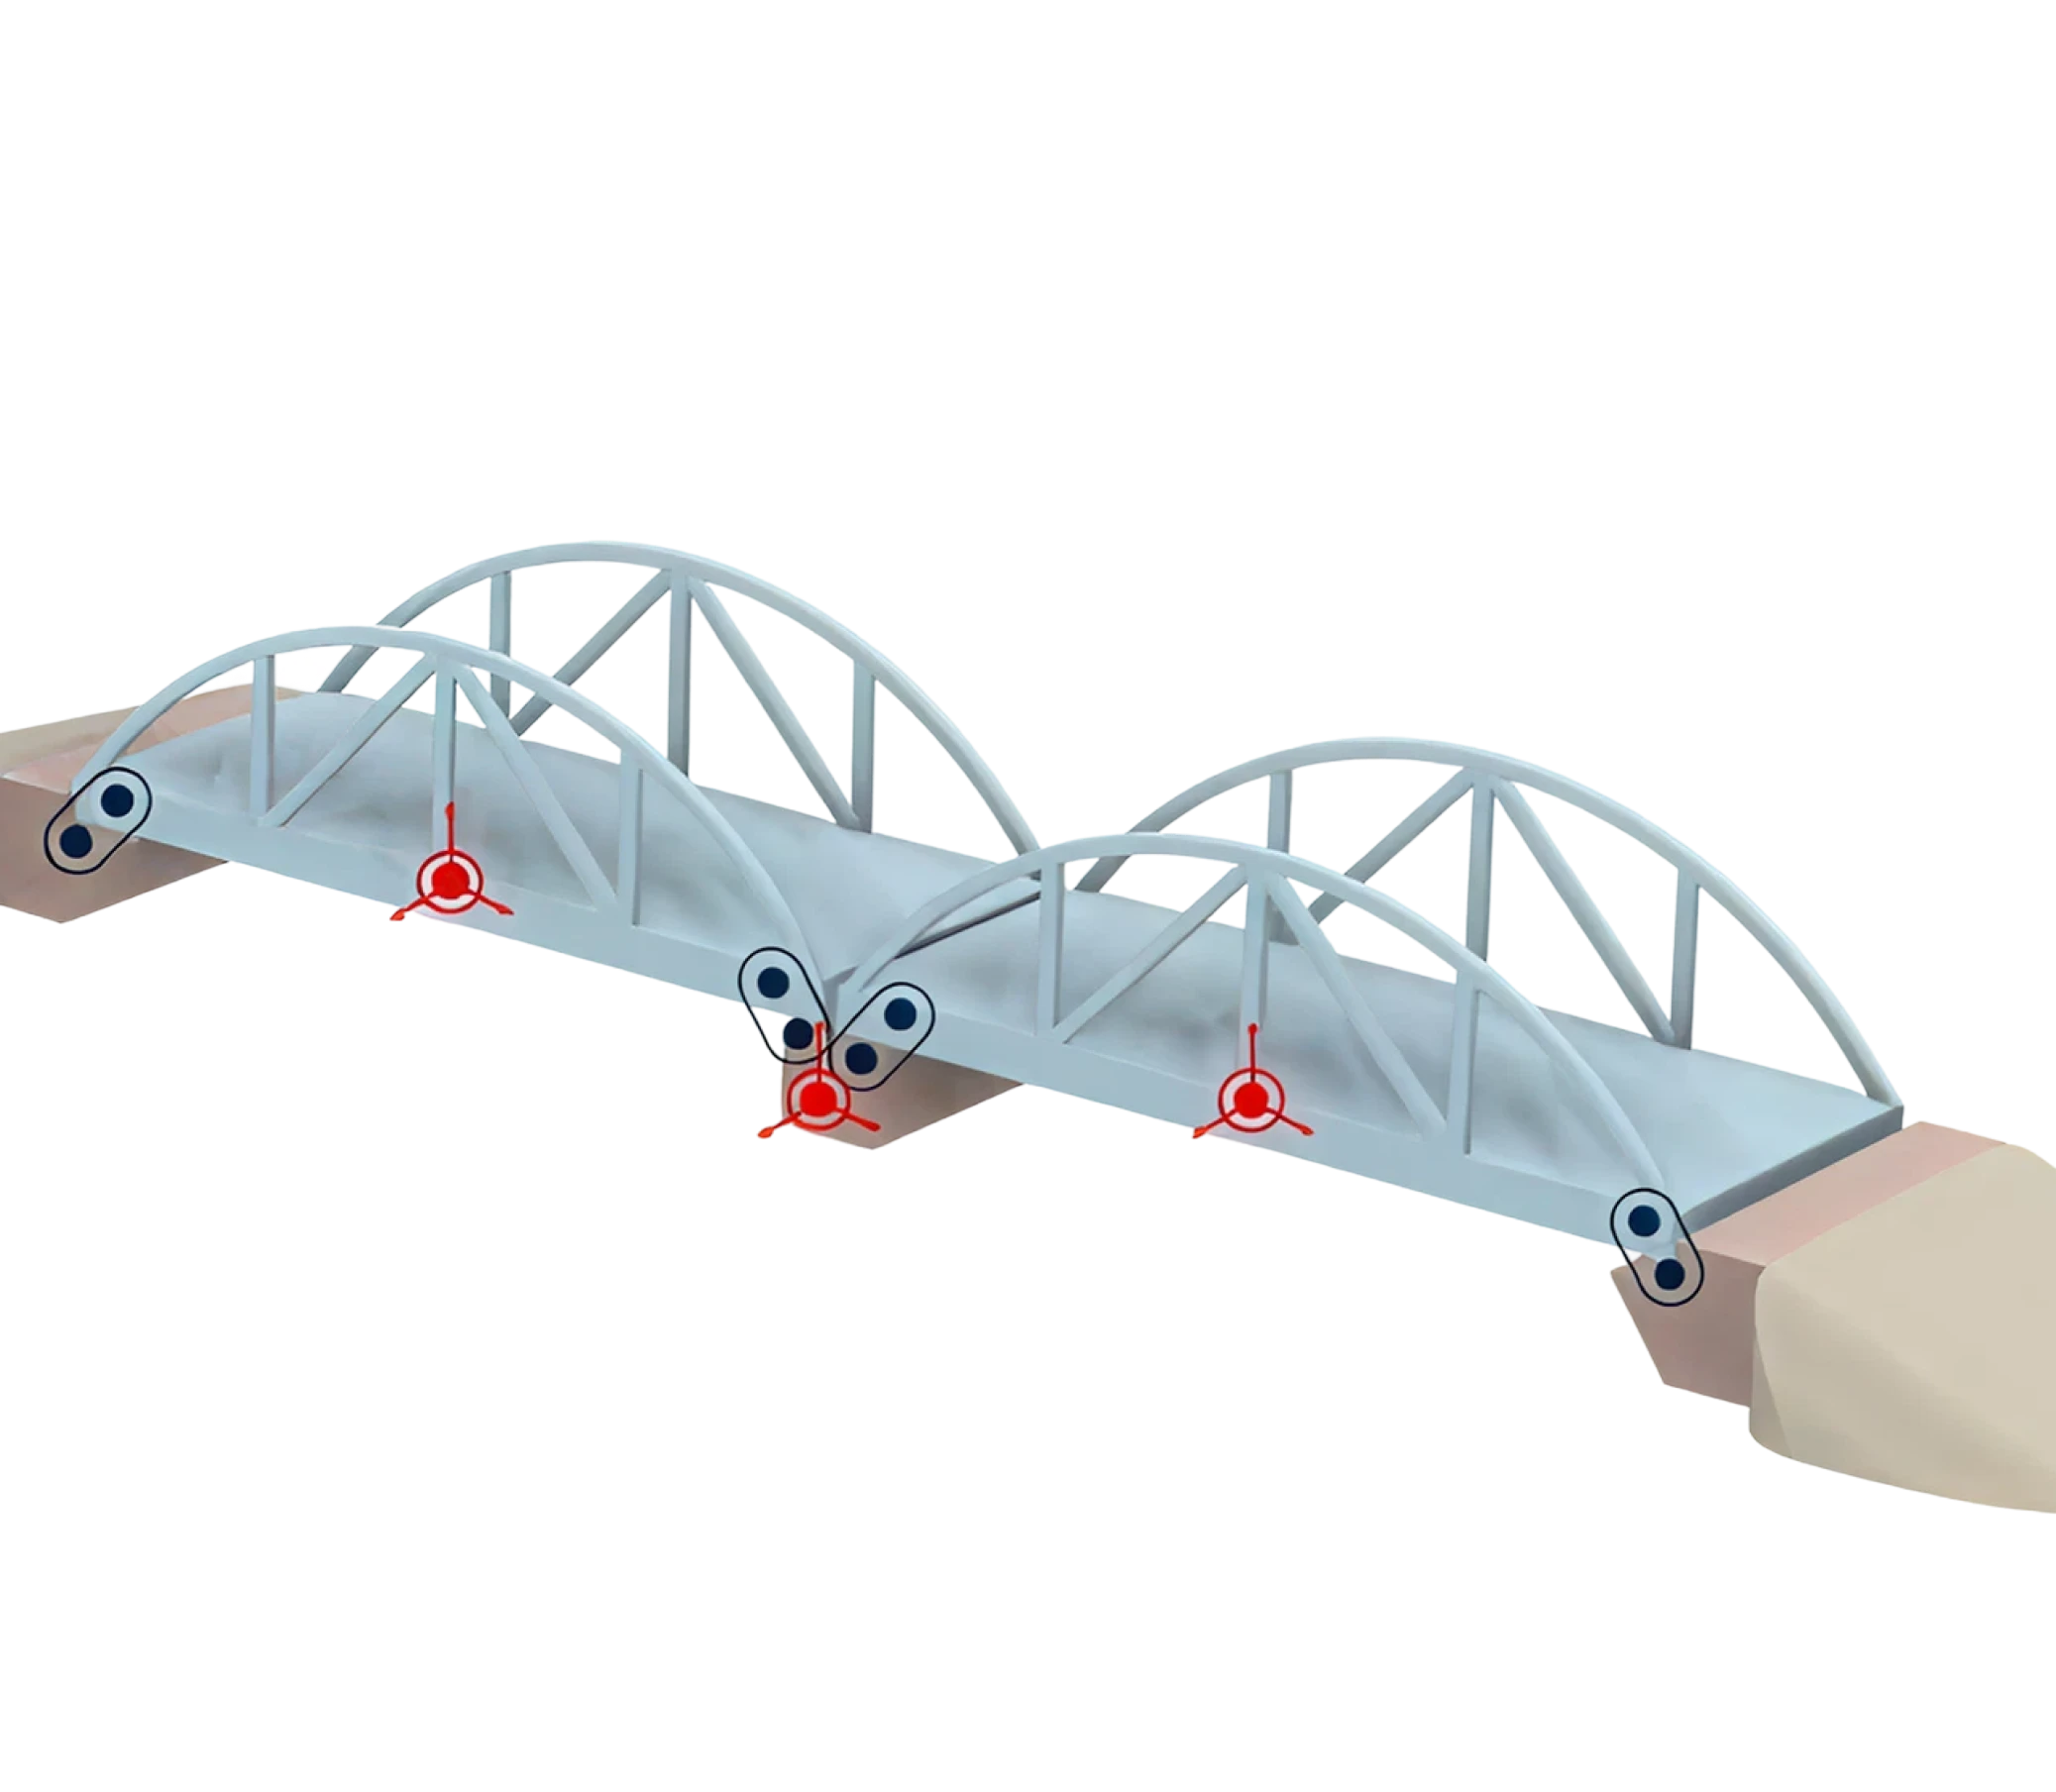
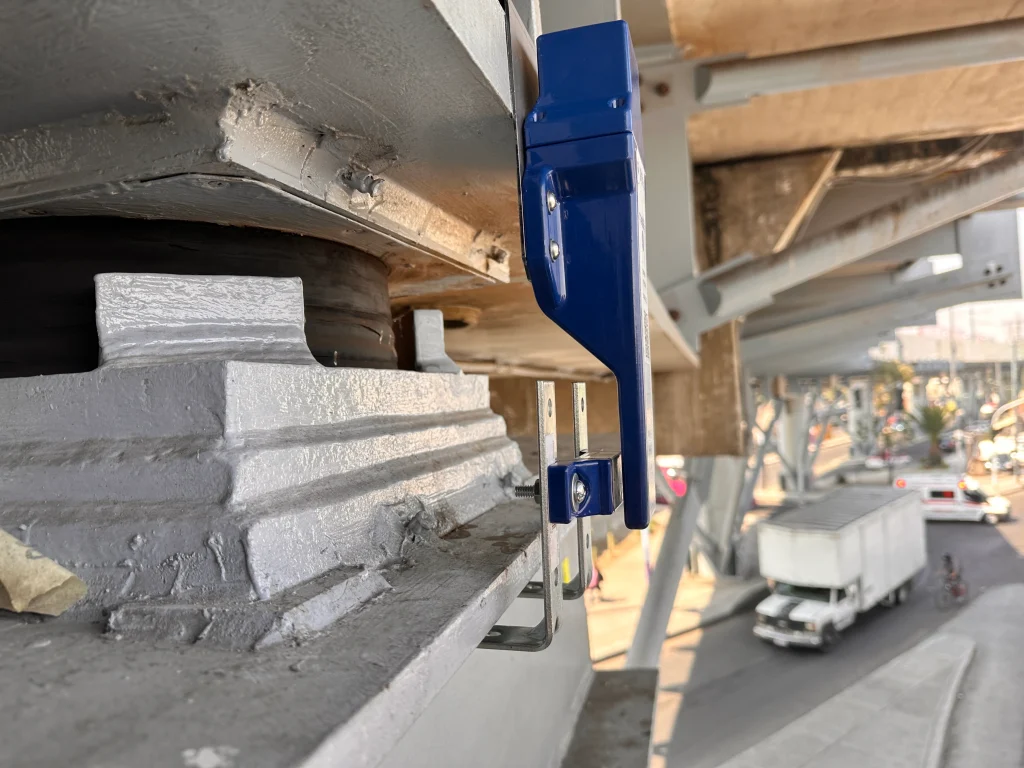
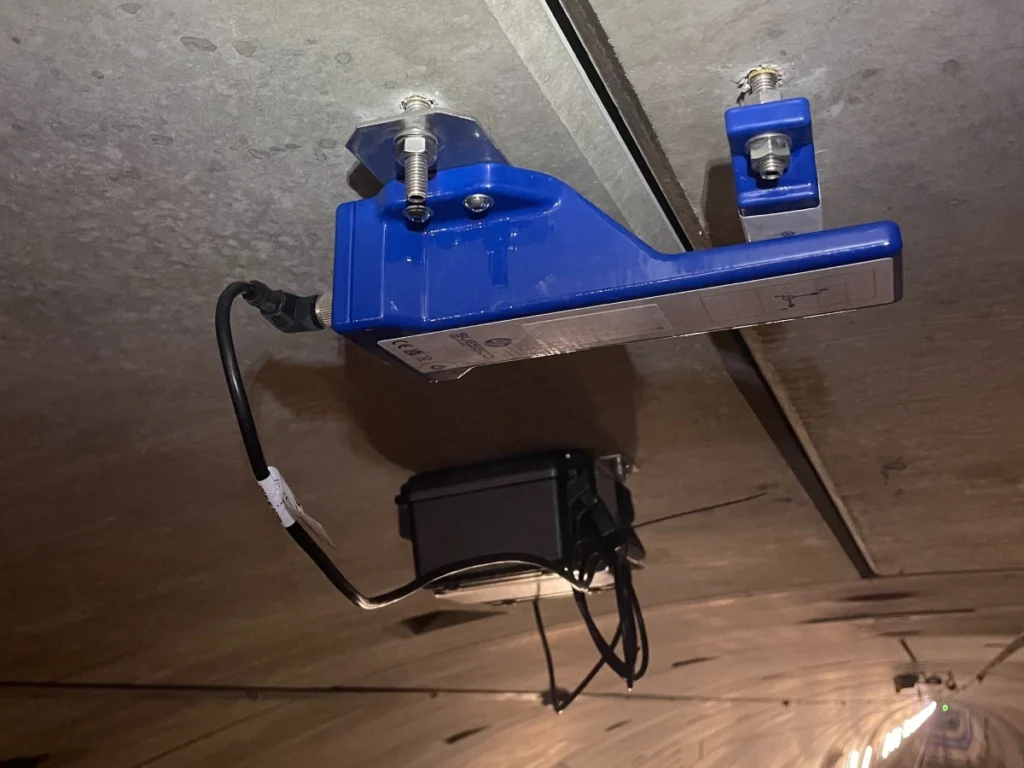
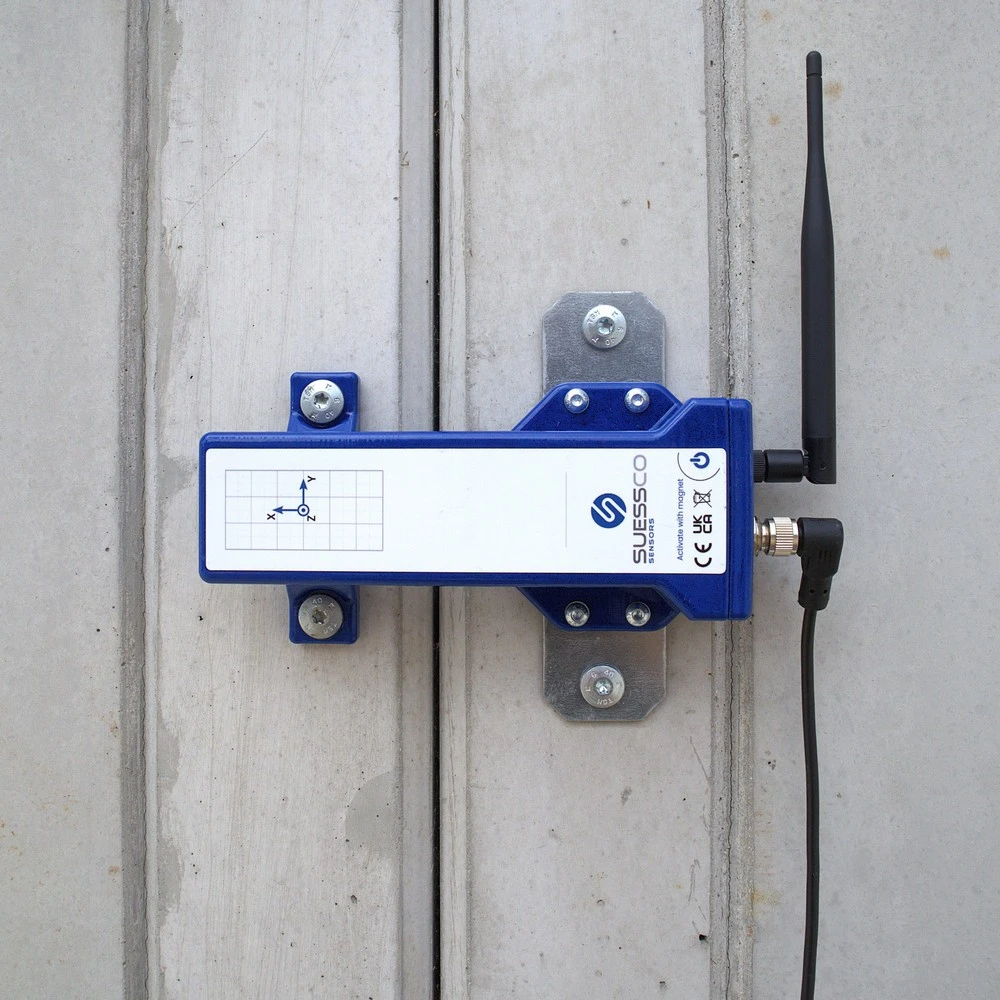
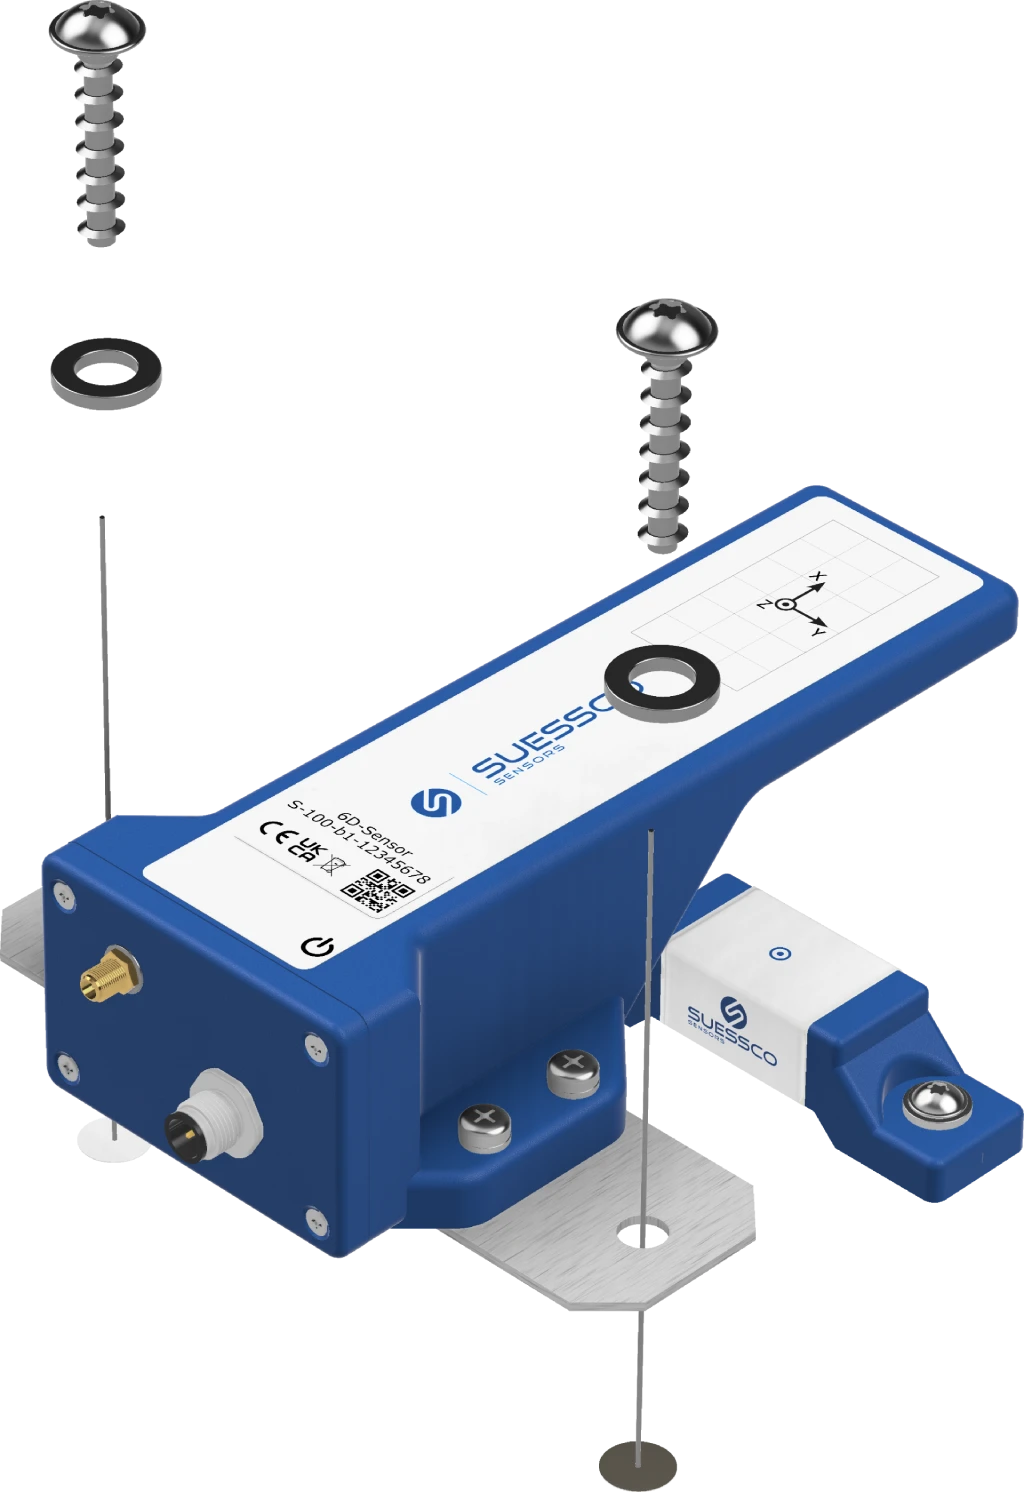
The reference object and sensor are each secured with two screws to the expansion joint between two masonry blocks, while the GNSS antennas are mounted at several points on the top of the wall and on the surrounding slope. No special tools are required, and there is no damage to the structural integrity of the building. The 6D sensor is activated by placing a magnet against it or connecting the battery cable.
2
6D Instructions

Automatically transfer measured values

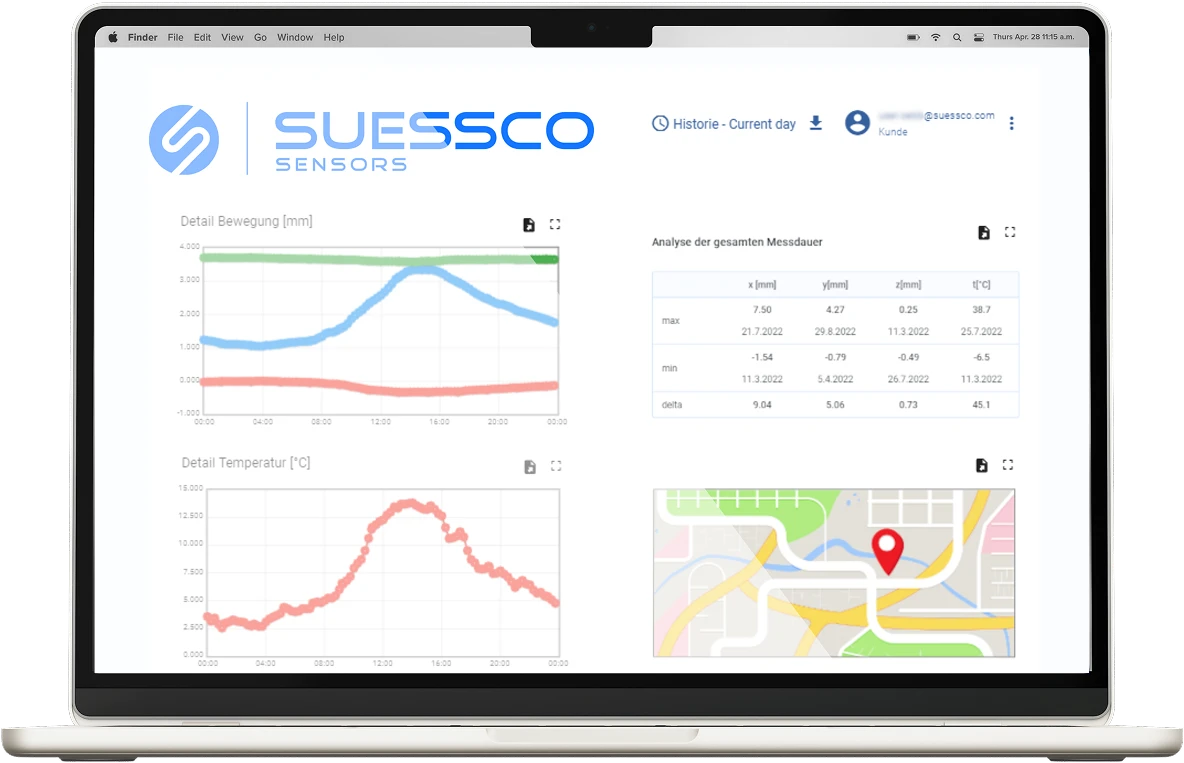
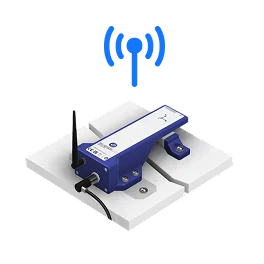
Once the sensors are active, they transmit displacement and rotation data wirelessly to our data hub. The 6D sensor uses LTE-M and Wi-Fi, while the GNSS system uses NB-IoT and LTE-M. The movement history can be accessed at any time as a time series without anyone having to travel to the wall.

3
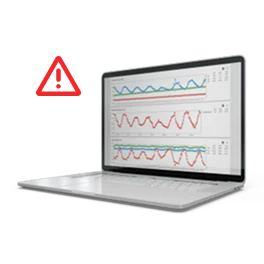
Laptop with graphs and data

Immediate notification if the threshold is exceeded

You define the critical thresholds for each monitoring point in advance, taking into account expected seasonal fluctuations. If these thresholds are exceeded, our system sends an email notification to the designated recipients. The complete history of water level changes is also available as documentation for the next dam inspection.

Measurement points for dam monitoring

Get advice now

Recommended sensors for dam monitoring

Spot joint measurements and large-scale geometry complement each other on the same structure.

6D sensor

The solution for spot measurements at expansion joints and masonry blocks. It measures translational movement along three spatial axes and rotation around three axes with a single installation. The integrated temperature sensor is particularly important for dams, as a large portion of the deformation is thermally induced.

Features:
  • Measurement in six dimensions (X, Y, Z, and rotation around three axes)
  • Repeatability: ±50 µm (translation), ±0.1° (rotation)
  • Built-in temperature sensor (±0.5 °C)
  • 10-year battery life with hourly measurements
  • Wireless transmission via LTE-M and Wi-Fi
  • Patent EP3792587B1

GNSS system

For large-scale monitoring of dam geometry and slope movements in the surrounding area using multiple antenna points. The dam is specifically listed as an application in the data sheet.

Features:
  • Absolute position in X, Y, Z across multiple antenna points
  • Accuracy: 1.3 mm in the X and Y axes, 2 mm in the Z axis
  • At least 3 sensor points and a fixed reference point within a radius of approximately 2 km
  • Measurement interval: once a day
  • Transmission via NB-IoT and LTE-M
  • Power supply via the grid or PV with a backup battery
GNSS system

What's changing for you

Specific differences compared to routine inspections and individual point sensors.

Six directions in one image icon

Point measurement and surface geometry in a single system

The 6D sensor records joint movement at individual points, while the GNSS system tracks the deformation of the entire wall. Both data streams are integrated into our data hub, eliminating the need for separate platforms for point-specific and large-scale measurements.

SuessCo Datahub Dashboard
All measurement data in a single dashboard. CSV export for structural engineers and reports, API integration for third-party sensors, and multi-tenant support for complex projects.
Datahub in Detail
Blue icon depicting a measuring instrument

Distinguish seasonal fluctuations from the actual trend

With continuous measurement over several years, the expected seasonal variation becomes apparent and can be distinguished from the long-term trend. A change that goes beyond the usual annual fluctuation becomes evident over time, rather than being obscured by the value on a specific date.

Early Warning logo

Early warning of critical changes

If a threshold is exceeded, our system automatically sends an email notification. Any developments outside the expected range are detected early on, without the need for an unscheduled inspection of the wall.

Blue thermometer on a circle icon

Temperature at the same measurement point for thermal deformation

A large portion of wall movement is caused by thermal factors. The 6D sensor’s built-in temperature sensor provides the corresponding temperature at the same measurement point with an accuracy of ±0.5 °C. This makes it possible to distinguish thermal deformation from structural changes.

Real-world projects

Selected dam monitoring projects using our sensors.

May1

Brentenberg Tunnel

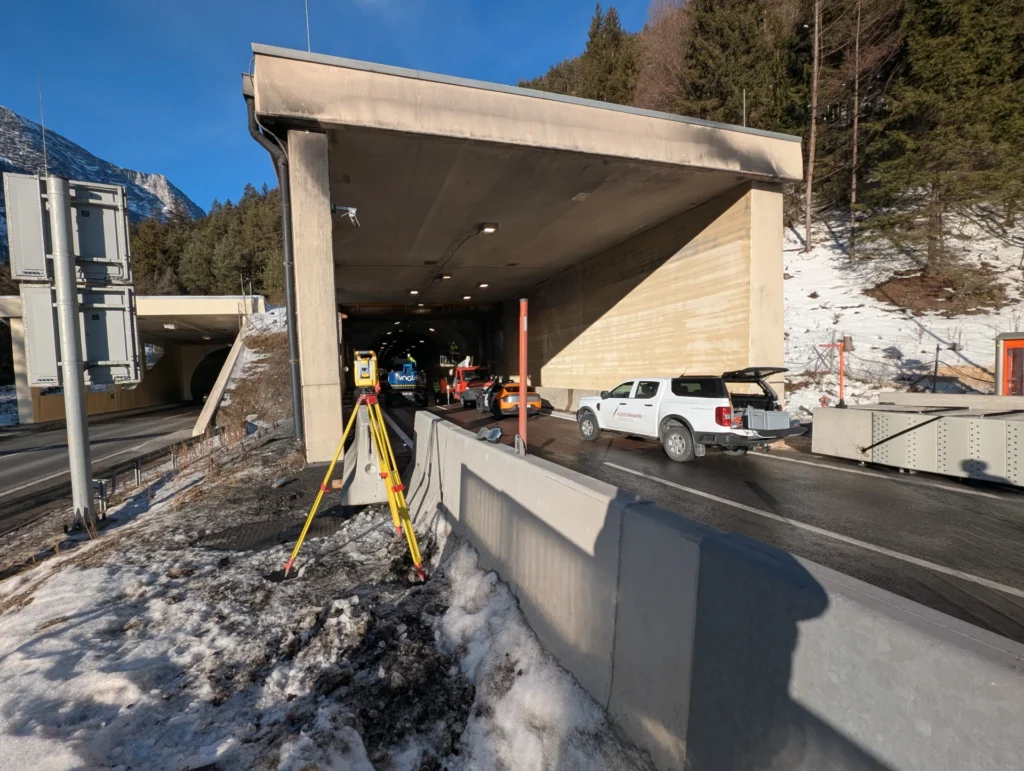
Real-time structural monitoring following a tunnel fire to enable rapid reopening during ongoing restoration work.

Building:
Tunnel
Location:
Austria
Sensors:
3D sensor
Read the case study
Brentenberg Tunnel

Rastatt Tunnel

Wireless 3D measurement of concrete segments in tunnel construction.

Building:
Tunnel
Location:
Germany
Sensors:
3D Sensor XT
Read the case study
Rastatt Tunnel

Stuttgart 21

Continuous monitoring of structural movements in the historic reception building during the critical construction phase

Building:
Historic train station building
Location:
Stuttgart, Germany
Sensors:
6D sensor, GNSS system
Read the case study
Stuttgart 21

Residential building

High-precision building monitoring of settlement and crack development to assess damage caused by subway construction work.

Building:
Historic building
Location:
Central Europe
Sensors:
3D sensor, 6D sensor, GNSS system
Read the case study
Residential building

Danube Bridge

Monitoring of bearing and abutment movements and structure temperature during operation.

Building:
steel bridge
Location:
Lower Austria
Sensors:
6D sensor
Read the case study
Danube Bridge
May1

What our customers say

/
FAQ

Frequently Asked Questions About Dam Monitoring

A dam's water level fluctuates within a predictable range throughout the year, depending on water levels and temperature. Continuous measurements taken over several years reveal these seasonal fluctuations. You define the threshold values based on these fluctuations, so that any exceedance indicates a trend outside the normal range.

Discuss dam monitoring for your structure

During the consultation, we will determine which combination of joint measurement and surface geometry is best suited for your wall and how the sensors can be installed without damaging the structure.
A man with his arms crossed and a smile